Financial Inclusion in the UK – up to date analysis of access to financial services
LexisNexis® Risk Solutions has carried out in depth analysis of its UK data sources, combining two of the UK’s largest Credit Reference Agencies (CRAs), short term loan applications and around 30 alternative public and private sources, to create a unique and comprehensive picture of UK Financial exclusion.
One in seven financially excluded
Analysis shows that around 7.1 million people (one in seven, or around 14% of the adult population) in the UK fall into the definition of ‘financially excluded’, meaning they could potentially struggle to access affordable and fair financial services. We also found over 637,000 people fall into the definition of Credit Invisibles, rendering almost three-quarters of a million people effectively un-scorable in credit-risk terms.
Regional matters
We analysed financial exclusion and negative financial data by age, across 380 UK local authorities to provide a granular picture of the extent to which populations, right down to a community level could be suffering from financial exclusion and vulnerability.
Use our interactive heatmaps to view how the causes of financial exclusion – including lack of a credit footprint or a bank account, use of subprime lending and the presence of negative financial credit history (CCJs and bankruptcy) – are distributed across the UK population, and how regions compare.
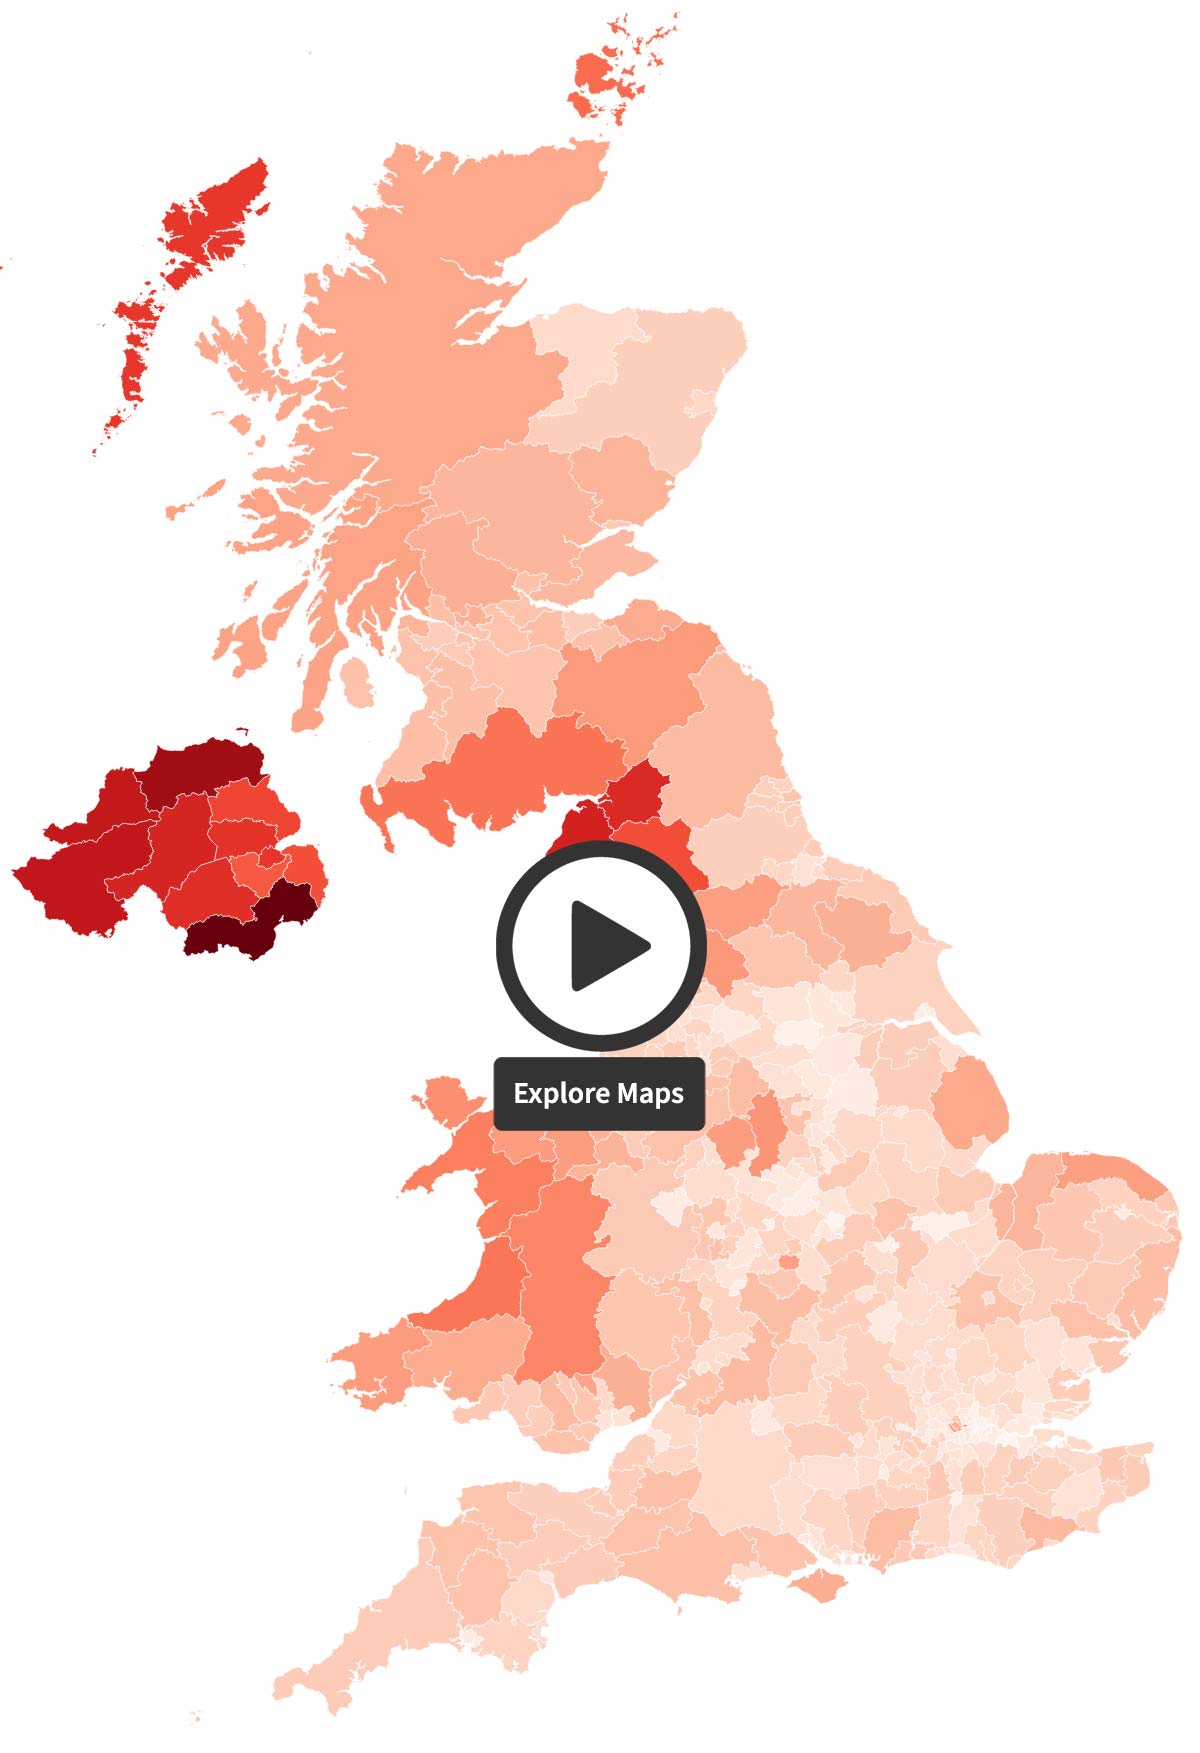
UK Financial Exclusion indicators, by local authority and age
2021 UK snapshot:
Almost 320,000
...individuals in the UK are classed as Thin File with no data footprint, financial or otherwise.
Thin File – defined as only 2 sources of non-financial data available, and no Derogatory or CRA data.
1.7 million
...people have no financial or credit service activity in the past 24 months (no CRA).
5.8 million
...people have no record of an open or closed bank account.
Around 7.1 million (13.7%)
...can be defined as potentially financially excluded – i.e. they would struggle to access the most affordable credit.
Over 637,000
...people can be classed as credit ‘invisibles’, making them impossible to credit score.
Almost two in five (38%)
...short term loan applications are made by 26-35 year olds.
Younger generations
...have a worrying dependence on subprime lending with a trend of defaulting on highly leveraged loans.
Around 1 in 10
...26-35 year olds and 36-45 year olds – over a million people in each group – have some sort of derogatory data, like CCJs or bankruptcy records on their credit file.
Definitions
Financially Excluded:
One who lacks access to ‘useful and affordable’ financial services because they can’t be credit risk scored via traditional methods. Typically includes lack of credit reference agency data over the past 24 months and/or only 2 sources of non-financial data, or no UK bank account.
Credit Invisibles:
(a.k.a. ‘Unscorables’) No useful credit footprint, or evidence of financial activity whatsoever to enable a credit risk assessment, and no UK current account.
Derogatory Data:
Negative financial records such as County Court Judgements (CCJs) and bankruptcy or insolvency orders – also includes debt reduction tools such as Individual Voluntary Arrangements (IVAs).
Regional breakdown
Our data provides a comprehensive view of the indicators of financial exclusion and vulnerability across the UK, today. Combining 2.6 billion records with our powerful statistical linking technology, we can identify over 54 million unique individuals living in the UK; our report uses this extensive coverage to provide a detailed picture of financial exclusion and its underlying causes across the UK adult population, including negative financial data and levels of subprime lending.
Financially Excluded: % of population affected
Credit Invisibles: % of population affected
No Bank Account: % of population affected
Derogatory Data: % of population affected
Subprime Lending: % of population affected
N.B. Our data coverage gives an account of around 95% of the adult population (16+).
Why does financial inclusion matter?
Access to financial services can have a huge impact on personal and economic outcomes, with a bank account often considered a gateway to other credit, savings and insurance products. Current account holders are more likely to start and grow businesses, invest in their education or health, manage risk and weather financial shocks, all of which can improve the quality of their lives.
The negative effects of exclusion can be far reaching, with individuals, facing high charges simply to access everyday cash and paying a premium for everything from financial and lending services, energy tariffs and even mobile phone data, resulting in them paying an estimated £1000 annual ‘poverty premium.’ Moreover, financially excluded people can experience other forms of social exclusion, or have other vulnerabilities related to old age, disability, deprivation, or a lack of digital skills.
What's in the report?
Age analysis
Our analysis identifies key variances in the root cause of exclusion amongst older, middle and younger age groups and reveals the UK age groups most likely to experience financial exclusion, as well as the age at which exclusion typically peaks.
Distribution of UK current accounts
As a key indicator of engagement in the financial system, UK current accounts are an important measure of financial inclusion and are considered a gateway to other financial services. Our analysis reveals the distribution by age and location of some 6 million people in the UK with no indication of an active or closed current account.
Exclusion triggers
Our study shows that many situational factors can contribute to making someone difficult to credit risk score, including graduates, divorcees, foreign nationals coming to the UK to start a new life, and those coming out of long-term hospital care, or the prison system.
The human impact
Read our case studies to find out more about how people can become financially excluded through no fault of their own and the impact it can have on their lives.
The Graduate
New to the UK
Newly Independent
Long-Term Unemployed
How alternative data solutions can help
Using alternative data sets, such as postcode indicators, public records and registers, UK Land Registry data, directorship information and educational and professional accreditations, can help organisations to build a more effective risk assessment of an individual.
In the US, the approach has already been proven successful, allowing 87% of a group of previously Unscorable individuals to be effectively scored, two thirds of whom proved to be the lowest risk customers.
Analysis of financially excluded UK individuals found that as many as 77% could be helped using alternative data solutions, meaning a further 5.7 million UK adults could gain access to fairer and more affordable financial services, for the first time ever.